The Nyquist frequency is calculated as twice the highest frequency component present in a signal. It represents the minimum sampling rate needed to accurately capture and reconstruct a continuous-time signal from its discrete samples, avoiding aliasing
The Nyquist frequency is a fundamental concept in digital signal processing and sampling theory.
Table of Contents
Definition
The Nyquist frequency is half of the sampling rate of a discrete signal. It represents the highest frequency that can be accurately captured (without aliasing) when sampling a continuous signal.
The Nyquist Rate
Digital signals are sampled from continuous analog signals. We know the value of the original continuous signal only at certain times. We want to be able to reconstruct the original continuous signal from the digital signal. In order to do so reliably, the signal must have limited bandwidth—its frequency components must be no greater than some known frequency fc. We must then sample the signal at a minimum rate known as the Nyquist rate
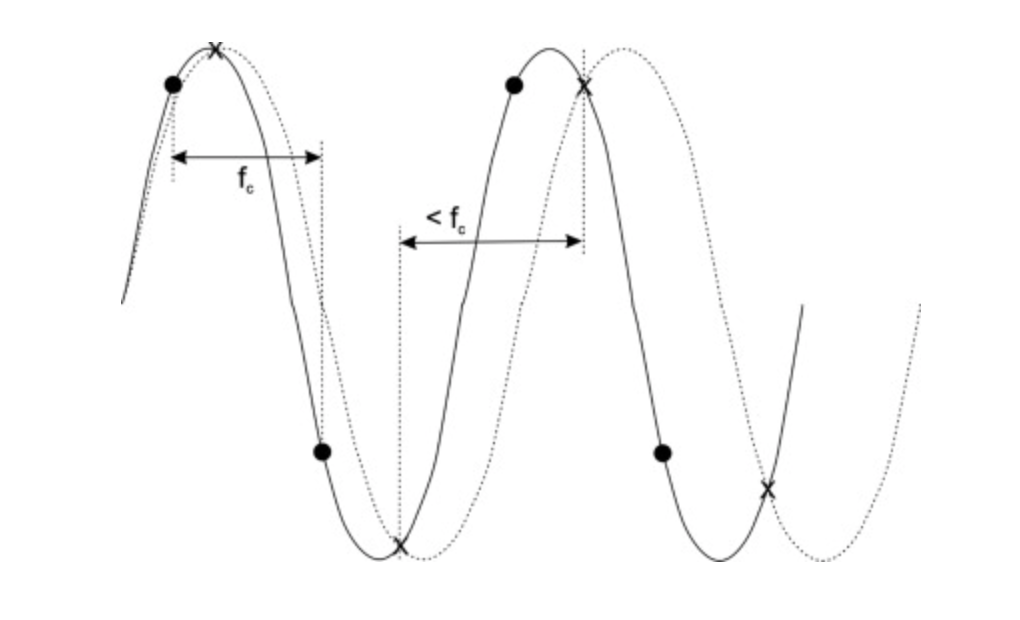
Fig. shows a sinusoidal signal and samples taken at two different rates. Given samples at the Nyquist rate, we can reconstruct the original sine waves If we sample at a lower rate, we can interpolate a signal at a lower frequency that fits all of the sample points. We can, in fact, interpolate an unbounded number of sinusoids at various frequencies. Most of those interpolated signals are wrong. This effect is known as aliasing. Signals at frequencies slightly higher than the sampling rate appear as aliases that are slightly lower than the sample rate. Signals farther away from the sample rate result in aliases at even lower frequencies. Aliasing causes distortion in our original signal that cannot be removed—we do not know which part of the sampled signal is actual and which is aliased.
THE NYQUIST CRITERION
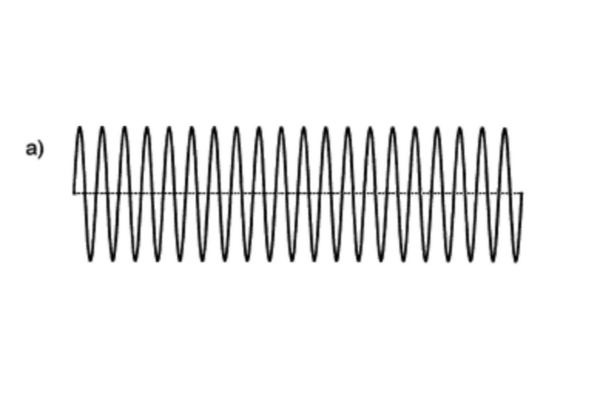
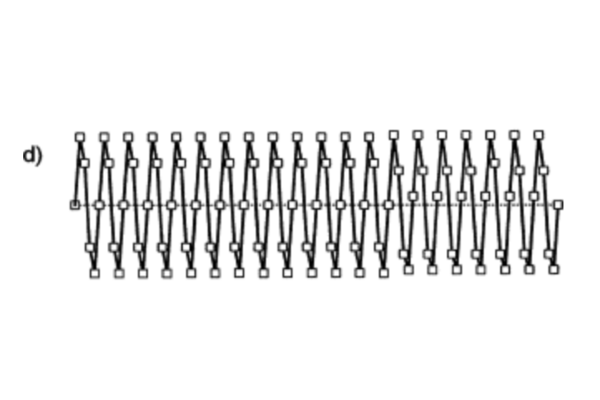
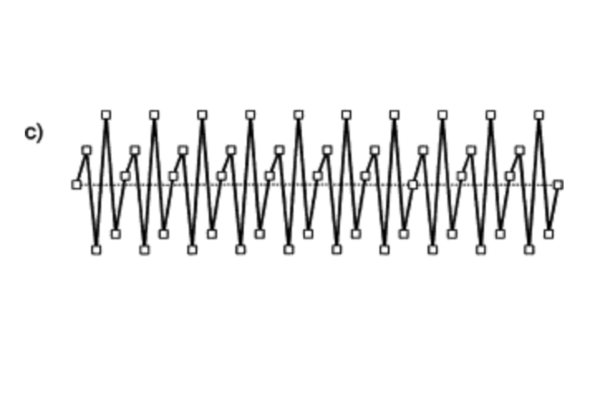
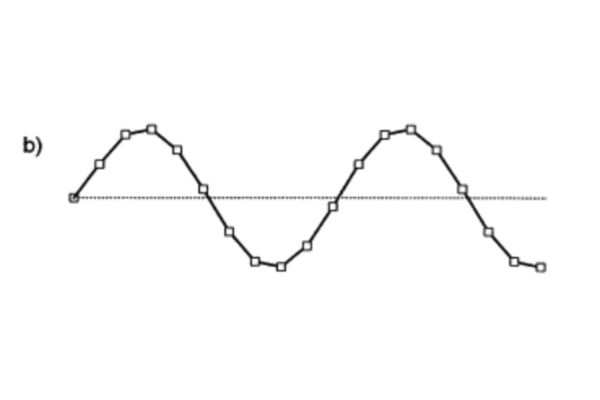
The correct choice of sampling rate is particularly important when periodic signals such as sine wave are being digitised since, if the rate is not sufficiently high, the digital representation can be highly misleading due to a phenomenon known as aliasing, which occurs when the sampling interval is too long to ensure that there are at least two samples per cycle of the sine wave. For instance, if a 1000 Hz sine wave digitised at a rate of 950 samples per second, no more than one sample per cycle is possible and, since the sample and sine wave frequencies are different, successive samples will be acquired from a different point on each cycle. As shown in Fig. below this results in a digitised record which is periodic, but has an apparent frequency of 90 Hz, not 1000 Hz. The precise value of this alias or false frequency depends upon the interaction between the sample rate and the sine wave frequency and would be different for a different sampling rate.
General Thought
To accurately represent a signal without distortion (aliasing), the sampling rate must be at least twice the highest frequency component present in the signal. This minimum sampling rate is the Nyquist rate, and the corresponding frequency is the Nyquist frequency.
The Nyquist rate is a property of the signal (its highest frequency component), while the Nyquist frequency is a property of the sampling process (determined by the sampling rate)
If a signal is sampled at 1000 Hz, the Nyquist frequency is 500 Hz. To avoid aliasing, the signal should ideally not contain any frequency components higher than 500 Hz.
If your recorder is having an option of setting sampling rate of 44kHz and 48kHz. By analysing the signal. It’s been found out that the highest frequency present in the signal is above 22050 kHz, let say 23010kHz, then on recorder we need to select 48kHz option not 44kHz option.
That 23010 kHz is the maximum signal frequency that can be accurately represented in a discrete signal without aliasing.
The original signal’s highest frequency must be less than or equal to the Nyquist frequency. This means the sampling rate must be at least twice the highest frequency present in the original signal.
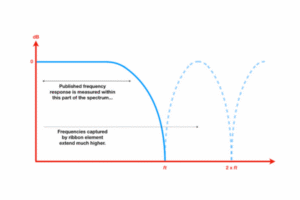
Anti-aliasing Filters
In practice, to prevent frequencies above the Nyquist frequency from causing aliasing, an anti-aliasing filter is typically applied before sampling. This filter is designed to attenuate or remove frequencies above a certain cutoff frequency, ideally matching the Nyquist frequency to ensure only the desired frequency range is sampled.
Calculating Nyquist frequency
Determine the Bandwidth (B) of the Signal: Identify the frequency range over which the signal carries significant information. This is also referred to as the highest frequency component of the signal.
Apply the Nyquist Criterion:
The Nyquist criterion states that the sampling frequency (Fs) must be at least twice the maximum frequency component (Fmax) of the signal to prevent aliasing and allow for perfect reconstruction of the original analog signal.
Nyquist Frequency Calculation: The Nyquist frequency (f_Nyquist) is half the sampling rate. It represents the maximum signal frequency that can be represented without aliasing in a discrete signal.
Therefore, to calculate the Nyquist frequency, first, determine the highest frequency (Fmax) present in your signal, and then multiply it by two to determine the minimum required sampling rate (Fs) according to the Nyquist criterion. Then, the Nyquist frequency is simply half of that sampling rate.
In general, f_Nyquist = Fs / 2 or, expressed in terms of the signal’s maximum frequency, f_Nyquist = Fmax (when the sampling rate is exactly at the Nyquist Rate).
Example
Let’s say a continuous-time signal has a highest frequency component of 10 kHz.
- Required sampling rate (Fs): According to the Nyquist criterion, Fs ≥ 2 * 10 kHz = 20 kHz.
- Nyquist frequency: The Nyquist frequency is Fs / 2 = 20 kHz / 2 = 10 kHz.
This means if you sample the 10 kHz signal at a rate of 20 kHz (the Nyquist rate), the highest frequency that can be accurately captured and represented without aliasing is 10 kHz, which is the Nyquist frequency.
In practice, a slightly higher sampling rate than the theoretical Nyquist rate is often used to ensure a margin of safety and account for imperfections in real-world systems like anti-aliasing filters.
Why it matters
When you sample an analog signal, any frequency component higher than the Nyquist frequency will be misrepresented in the sampled data. This effect is called aliasing.
To avoid aliasing, you must ensure:
Your signal contains no frequency components above the Nyquist frequency.
Or, use an anti-aliasing filter (low-pass filter) before sampling.
Example
If you sample at 44.1 kHz (common in audio, like CDs), the Nyquist frequency is:
fNyquist=44,1002=22,050 Hzf_{Nyquist} = \frac{44,100}{2} = 22,050 \, \text{Hz}fNyquist=244,100=22,050Hz
Where 44.1 kH is Nyquist Frequency Rate and 22,050Hz is Nyquist Frequency
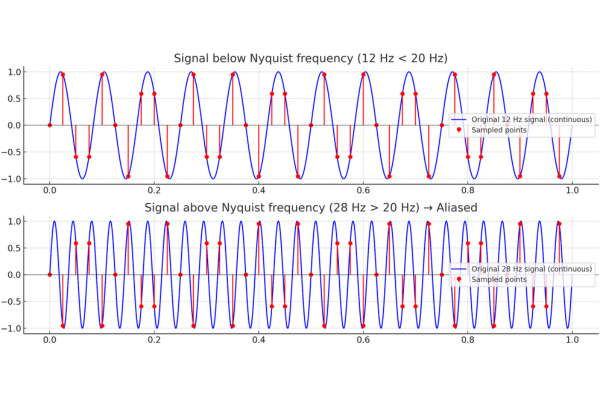
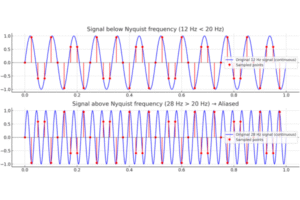
Here’s the graphical explanation of the Nyquist frequency and aliasing:
Top plot (12 Hz):
The recieved signal (while recording) frequency is below the Nyquist limit (20 Hz). The sampled points (red) correctly represent the continuous waveform (blue).
Bottom plot (28 Hz):
The recieved signa (while recording)l frequency is above the Nyquist limit. The sampled points (red) no longer match the original waveform (blue) — instead, they “fold back” and look like a lower frequency. This is aliasing.
Alright, so below graph with both the 28Hz and 12Hz continuous curves. The user wants to show the sampled points from the 28Hz waveform, and how they overlap with the 12Hz curve. I’ll make sure the graph has a single plot with the curves clearly labeled, including the sampled points and legend. Default colours work fine here
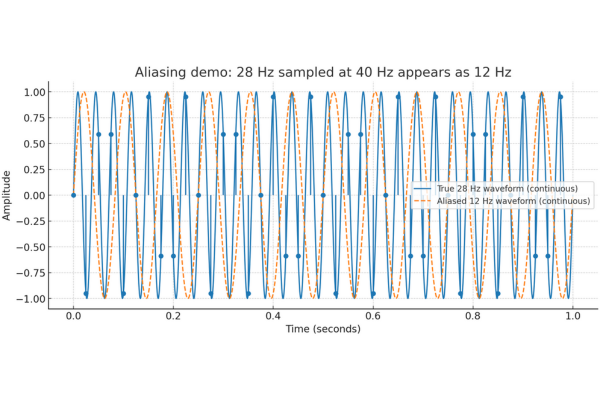
The above graph seems complicated to you, please ignore it.
If the above graph is putting in the state of confusion then please refer the conclusion.
Conclusion
The Nyquist frequency is not something you “set” directly like a control knob, but rather it’s a consequence of the sampling rate you choose for digitizing a signal. It serves as a critical threshold, where frequencies below it can be accurately reconstructed from the samples, while frequencies above it can lead to aliasing and signal distortion